In my first article, I laid out the basic premise for this series: an examination of how Agile has gone from the darling of the application development community to a virtual pariah that nobody wants to be associated with, and an exploration of the very important question of what we should replace it with. We […]
Businesses today are drowning in data. The sheer volume and complexity of information available have made it increasingly difficult for organizations to extract meaningful insights using traditional business intelligence (BI) tools and the expertise of specialized data scientists. This is where augmented analytics comes in. This game-changing technology combines the power of artificial intelligence (AI) […]
In recent years, we have seen substantial pushback on many fronts against Agile as a viable and important project management methodology. In my 2016 book, “Growing Business Intelligence”[i] (a book about Agile BI), I quoted from a 2014 article by Dave Thomas, one of the signers of the “Agile Manifesto,” in which he recommended retiring […]
A dashboard is a visual snapshot of business performance using KPIs (key performance indicators) to help users make smarter, data-driven decisions. An effective dashboard simplifies the visual representation of complex data and helps stakeholders understand, analyze, and present key insights at a glance. At the core, the objective of a dashboard is to make complex […]
In the current economic environment, employee productivity, efficiency, and well-being have become even more critical to organizational success, mandating that leaders spend more time understanding and deriving insights from employees’ digital footprints and data. But too often, businesses make strategic decisions without factoring in workforce data. This can result in costly mistakes such as unnecessary […]
Data is the lifeblood of modern organizations, and as such, it must be carefully managed and protected. Whether it’s financial data, personal health information, or customer data, organizations that generate and manage data must implement a comprehensive data governance strategy. A robust data governance policy ensures compliance and security and improves the quality of Business […]
The Wharton School of Management reports that only half of an audience is convinced by a purely verbal presentation, but that number jumps to over two-thirds when visuals are added. Why is that? The answer is simple. Our brains grasp and respond to images, colors, and patterns and more quickly assimilate information. Presenting data with colors […]
In today’s fast-paced world, the concept of patience as a virtue seems to be fading away, as people no longer want to wait for anything. If Netflix takes too long to load or the nearest Lyft is too far, users are quick to switch to alternative options. The demand for instant results is not limited […]
Dashboard software presents data using interactive visualizations.
Data analysts, statisticians, and business intelligence analysts often find it difficult to organize complex data sets, identify anomalies, and visualize the correlations between them. Like these professionals, if you also frequently work with data and present the analysis to stakeholders, then dashboard software could be of use to you.
Dashboard tools allow you to track, collect, and visualize complex data using elements such as graphs, charts, tables, and maps. They help present key data findings in an easy-to-understand format to clients, team members, or other stakeholders.
There are many free dashboard software options that you can use to check out your required software functionality before deciding whether to invest in a paid tool.
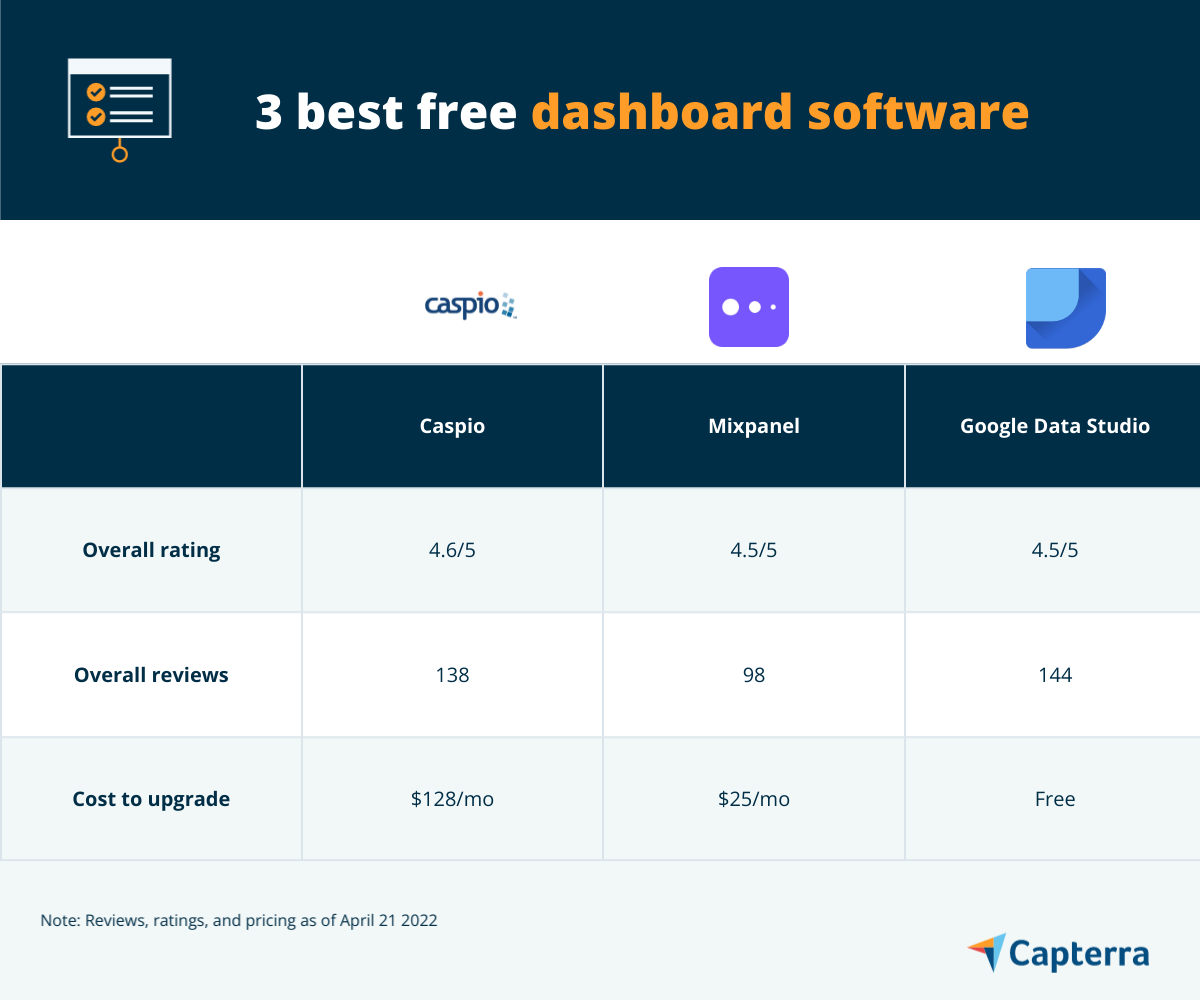
This article highlights three top-rated free dashboard software tools (listed alphabetically) based on user reviews and ratings. (Read how we selected these products.)
/See the full list of dashboard tools in Capterra’s software directory.
Caspio is an online application building platform that allows you to develop custom database applications without coding. It lets you create searchable and professional-looking dashboards with rich database features such as ad-hoc search and filtering control.
With Caspio’s visual application builder, you can create around 20 different types of dashboards, including business intelligence dashboards, sales dashboards, marketing dashboards, financial dashboards, and HR dashboards. You can simply upload data from a spreadsheet to the Caspio platform and create graphs, tables, and charts (pie charts, line charts, donut charts) that can all be embedded in the same web page to consolidate information into a single view.
The dashboards created via Caspio can be shared with internal as well as external stakeholders. In addition, the software offers various security features to ensure only authorized users have access to dashboard data. These features include the Health Insurance Portability and Accountability Act (HIPAA) compliance, account security control, and user authentication via single sign-on.
Caspio offers phone, email, and chat support to its customers.
Mixpanel: Displays multiple dashboards in a single view
Mixpanel is online analytics software that analyzes customer behavior by tracking in-product interactions, such as the number of times a product page is viewed, time between visits, and overall conversion ratio.
The software lets you create customizable dashboards to display key metrics such as the number of customers acquired, revenue earned, amount of website traffic, and user engagement rate. Its multi-dashboard view displays all your dashboards on a single screen. You can add multiple dashboards to this centralized view instead of jumping between separate dashboards.
Mixpanel’s pin-to-mobile feature allows you to view dashboards even on your mobile device. You can share dashboards via a link. You can also give viewing or editing permissions to team members. All newly-built dashboards remain private by default.
The data you enter into the Mixpanel dashboard is updated in real time, allowing your team to work on the latest figures. The software sends automatic notifications if there’s an unexpected change in your business metrics.
Mixpanel offers phone, email, and chat support to its customers.
Google Data Studio: Provides pre-built dashboard templates
Google Data Studio is an online dashboard and data visualization tool that allows you to create customizable reports and dashboards. The software uses artificial intelligence (AI) to combine and analyze data from multiple sources, such as Google Sheets and Microsoft Excel, to create dashboards. It also lets you import data from various third-party tools, such as Asana, Jira Cloud, and Funnel.
The software offers pre-built interactive dashboard templates to quickly create a new dashboard. The best part is that these templates are available free of cost. You can customize every aspect of your dashboard, including the background, color, font, style, and icons. You can also add text, shapes, and images to enhance the look of the dashboard, explain context, and highlight important aspects of data.
Google Data Studio lets you link data from Google services such as Google Analytics and Google Ads. You can invite internal and external stakeholders to collaborate on dashboards and reports and view edits in real time. You can also manage dashboard security by granting access rights to only authorized users.
Google Data Studio offers email support to its customers.
Selecting a free dashboard tool can be tricky. Let’s discuss some important factors you must evaluate before finalizing your purchase.
Select software that supports your business requirements. Dashboard software can be broadly classified into three types: operational, strategic, and analytical. If you need to monitor day-to-day business activities, consider investing in an operational dashboard, as it’s designed to provide a comprehensive snapshot of your daily activities. But if you want to measure key metrics such as the annual revenue and number of new customers, then a strategic dashboard will most likely serve your purpose. The dashboard provides insights into business strategy and is, therefore, used by senior management. Similarly, consider an analytical dashboard if you are focused more on analyzing historical data, comparing it with different variables, and establishing targets based on these insights.
Select software with customization capabilities. Not everyone interprets data the same way. Therefore, you need a software solution that allows you to visualize and present data the way you want. Shortlist a platform that offers different visualization options, such as Gantt charts, graphs, boards, and tables. The software should also allow you to adjust the font size, background color, style, theme, and logo of your interactive dashboard to make it visually appealing and comprehensible for all.
Select software that facilitates dashboard sharing. While selecting a free dashboard reporting tool, be sure to check the cross-company sharing functionality of the product. Other than standard sharing options, which include manual exports to PDF and email reports, the software should allow you to embed dashboards into a website or share them via a public link that can be password-protected for additional security. Many dashboard software options available on the market also allow you to share customized dashboards that have selected information or filters. Look out for such options before finalizing your purchase.
Common questions to ask when choosing free dashboard software
These are some common questions that you should ask vendors when selecting a free dashboard tool for your business:
Does your software support multiple data sources?
Before you invest in a free dashboard platform, make sure it allows you to combine metrics from multiple data sources, such as Google Analytics, Oracle, Twitter, YouTube, Spreadsheets, and Microsoft SQL Server. The software should also send real-time notifications in case there’s a change in the data metrics.
Does your software facilitate collaboration?
To facilitate collaboration, dashboard software should allow you to share dashboards with employees as well as external stakeholders. The platform you choose should let you add comments on dashboards, create slideshows, invite others to edit or provide feedback, view edits in real time, and grant access permissions to specific users.
Does your software offer a mobile format?
Dashboard visualizations should look appealing regardless of the device you use. Select a tool with a mobile counterpart that allows you to access, edit, and view dashboards (without any distortions) even on tablets and smartphones. This will help you access important information from anywhere without the need to login into the desktop version every time.
How did we choose these products? We didn’t—you did
To find your ideal software match, you need information you can trust so you can save time, stay on budget, and focus more energy on growing your business. It’s why we vet and verify all our user reviews and recommend only the tools endorsed by people like you.
In other words, our product recommendations are never bought or sold, or based on the opinion of a single individual—they’re chosen by your peers, reflecting the views and experiences of our independent base of software reviewers.
At Capterra, we objectively select and rank products based on a methodology developed by our research team. Some vendors pay us when they receive web traffic, but this has no influence on our methodology.
To be considered for this list, products have to:
Have at least 20 unique product reviews published on Capterra within the past two years, with an average rating of 3.0 or higher (as of April 20, 2022). We selected the three products with the highest ratings to feature in this article.
Offer a free, stand-alone version of the software—not a trial version you have to purchase after a certain amount of time to get the full experience.
Meet our definition of dashboard software: “Dashboard software is an information management tool that visually tracks, analyzes, and displays key performance indicators (KPIs) to help businesses make informed decisions and improve productivity and the efficiency of their workflows. Dashboards provide a customizable interface that collects real-time data from multiple sources and displays the generated insights in the form of charts, tables, gauges, and timelines.”
The “Best functionality” tool is identified based on the highest user ratings for functionality that a vendor received based on publicly available reviews (as of April 20, 2022).
Product research for this article was contributed by Himanshi Arora.

</span></p>")

</span></p>")

</span></p>")